
What Is a Trading Strategy? The Signal Is Only the Starting Point
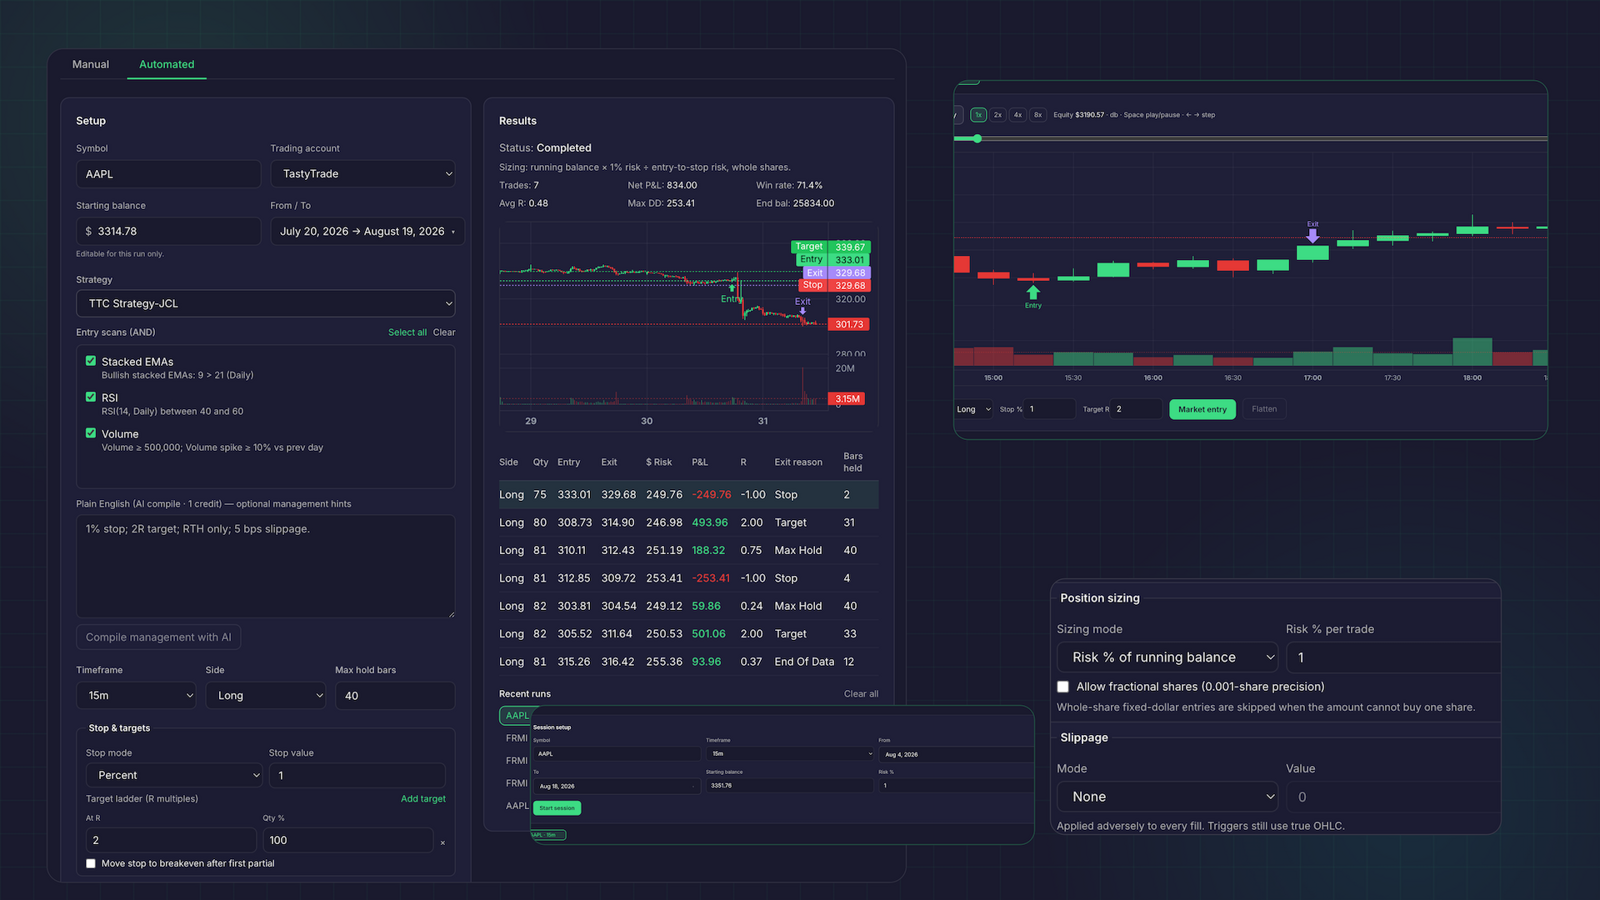
A trading strategy is a set of rules that helps you decide what to trade, when to enter, how much to risk, and when to exit. It gives your decisions a repeatable structure. It does not predict the future or guarantee a result.
Traders often use “strategy” to describe a particular signal or technique: trading price levels, watching MACD, or following momentum, for example. Those are valid starting points. But a signal alone does not explain how you’ll manage the trade. What you add around that signal is what makes your strategy complete, and distinct from someone else’s.
A signal is one part of a rules-based process
A trading strategy is a decision framework you can describe clearly enough to follow, test, and review. It should cover:
- What you trade: for example, stocks, options, or a defined group of tickers.
- What conditions you look for: the context that makes a setup relevant.
- What triggers an entry: the observable event that tells you your rules are met.
- How you manage risk: where the trade is invalidated and how you determine position size.
- How you exit: the conditions for taking profit, cutting a loss, or closing for another reason.
- How you review: what you record to see whether you followed the plan.
These rules support decisions; they don’t make decisions for you. Markets change, signals can fail, and even a carefully defined approach can lose money.
Common techniques traders call strategies
Each technique below can form the core of a strategy. Each also leaves important choices for you to define.
Trading price levels
A price-level approach focuses on areas such as support, resistance, prior highs and lows, or other levels you mark on a chart. A price reaction at a level may interest you, but the level alone doesn’t tell you whether to enter on a touch, a close, a breakout, or a retest. You still need rules for confirmation, risk, and exits.
MACD
MACD compares moving averages to help assess momentum and trend direction. Traders may look at a crossover, the histogram, or whether MACD is above or below zero. The indicator does not tell you which market conditions to trade, how much to risk, or what to do when a crossover occurs in a choppy range. See Fidelity’s MACD guide for more on how the indicator is commonly interpreted.
Momentum trading
Momentum traders look for strength or weakness that may continue. They might focus on price movement, relative volume, a new high or low, or a combination of factors. A momentum signal still leaves open which stocks qualify, what counts as confirmation, and where the trade idea is no longer valid.
Breakouts and pullbacks
A breakout approach looks for price moving beyond a defined range or level. A pullback approach looks for price to retrace before continuing in a trend. Both require you to define the setup: how you mark a range, what confirms a break or retracement, and how you handle a failed move.
TTM Squeeze and The Strat
TTM Squeeze setups use volatility and momentum concepts to identify periods when a move may follow consolidation. The Strat uses price-action patterns and timeframes to classify candles and setups. Neither name by itself defines your entry, risk, or exit rules. Your specific conditions make the approach testable.
Cash-secured puts and covered calls
These options-income approaches have more structure than a single chart signal, but they still involve choices. You need rules for selecting a ticker, expiration, strike, and position size, as well as a plan for assignment, closing, or adjusting a position. An options strategy should account for the risks of the position, not just the premium you hope to collect.
Why the base signal isn’t enough
Two traders can see the same MACD crossover and make different decisions. One may only trade it in the direction of a higher-timeframe trend. Another may require a breakout above resistance and above-average volume. They may use different stops, position sizes, profit targets, and rules for exiting when the signal reverses.
That means the indicator is not the complete strategy. The surrounding rules determine how you use it, and whether you can apply the same process consistently.
What you add to make the strategy yours
Add context filters
Context filters narrow down when your base signal is relevant. You might define a trend direction, price range, volume threshold, market condition, or timeframe. Be specific. “Trade with the trend” is hard to test until you explain how you identify that trend.
Define your risk
Set a point that invalidates the trade idea. Then decide the maximum amount you’re willing to risk before you enter. A stop is part of a plan, but it does not guarantee an exact fill price, especially in fast-moving or gapping markets.
Write position-sizing rules
Position size connects your planned risk to the distance between entry and stop. For a stock trade, that generally means calculating a share count. For options, contract value and the structure’s potential risk also matter. A position-sizing calculator can help with the arithmetic, but you choose the risk limits and the trade.
Plan your exits
Define how you’ll take profit and what will make you leave the trade early. Your rules might use a price target, a trailing stop, a change in the setup, or a time limit. Write them down before entry so you’re not inventing exit rules under pressure.
Review what you actually did
Record the setup, your decisions, and whether you followed your rules. Review the results over a meaningful sample rather than judging the strategy by one trade. A journal can help you distinguish between a rule that needs testing and a rule you simply didn’t follow.
One momentum idea, two different strategies
The examples below are illustrative, not recommendations. They show how extra rules change the same base idea.
Strategy A: Trend continuation
- Trade liquid stocks that meet a defined price and volume filter.
- Look for momentum in the direction of a higher-timeframe trend.
- Enter after a defined continuation trigger.
- Set the stop at a preselected invalidation level.
- Size the position based on the planned risk; exit at a defined target or according to a written trailing-stop rule.
Strategy B: Range breakout
- Watch a defined list of stocks that have formed a price range.
- Require a close above the range and a chosen momentum confirmation.
- Decide in advance whether to enter on the close or wait for a retest.
- Place the stop at a rule-based level that would invalidate the breakout.
- Set a target or trailing exit, and exit if the breakout fails under your stated conditions.
Both use momentum. The filters, entry trigger, risk rules, and exits make them different strategies. You can compare them only after you define those differences clearly enough to test.
Keep the rules connected from plan to review
When your rules live in separate notes, spreadsheets, scanners, and journals, updates can get missed. A connected workflow helps you keep the same criteria together: define rules, scan for setups, calculate size, plan the trade, and review what happened.
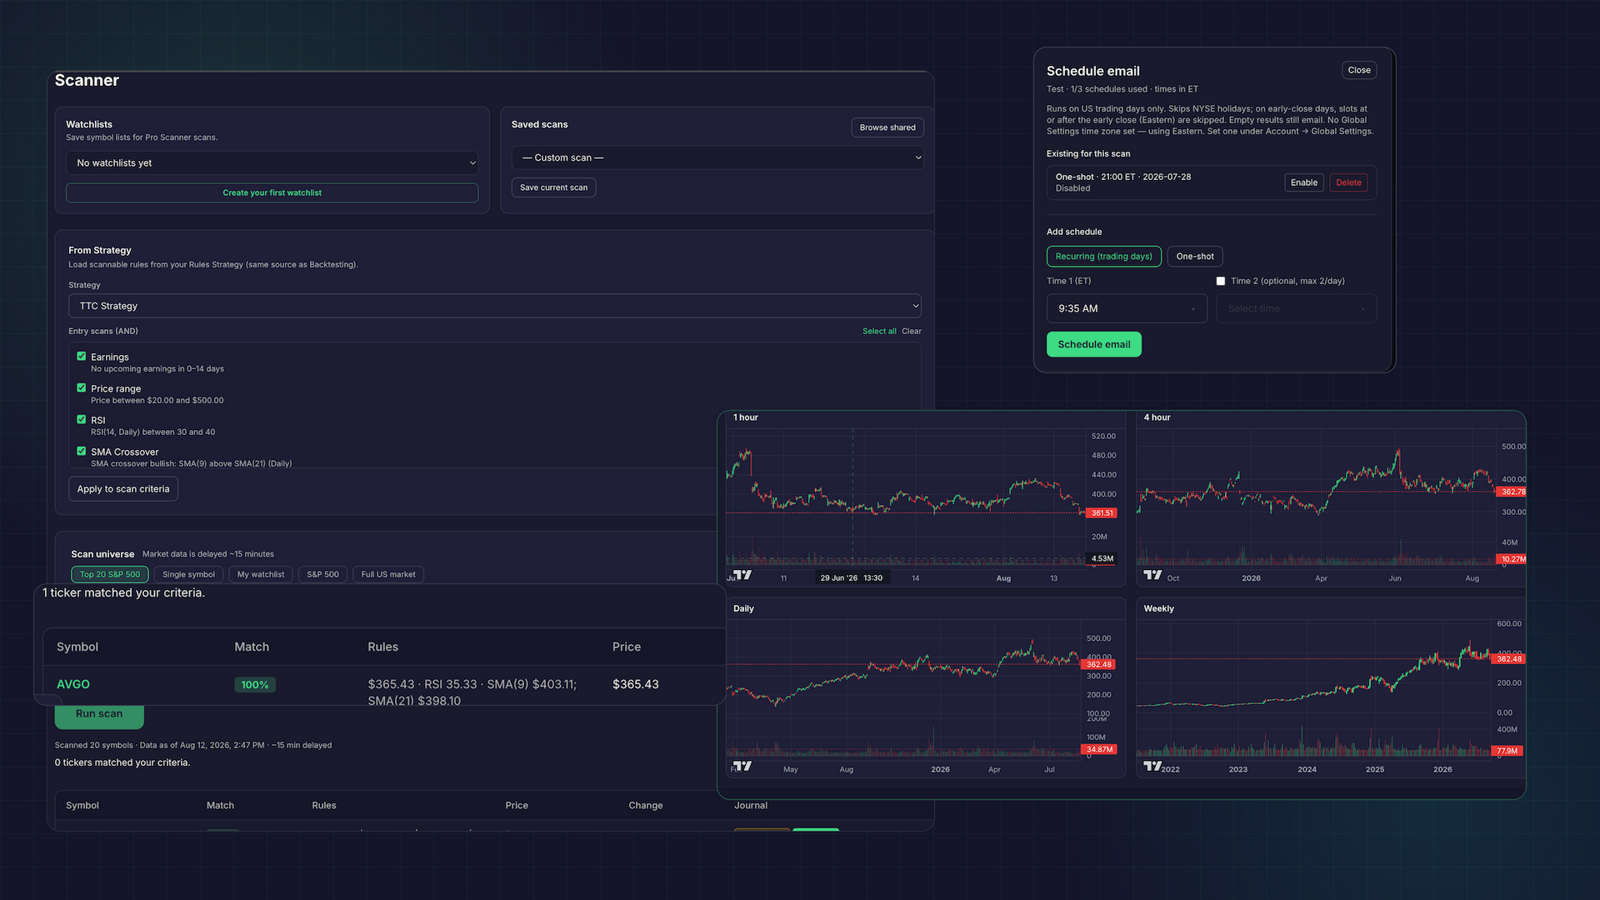
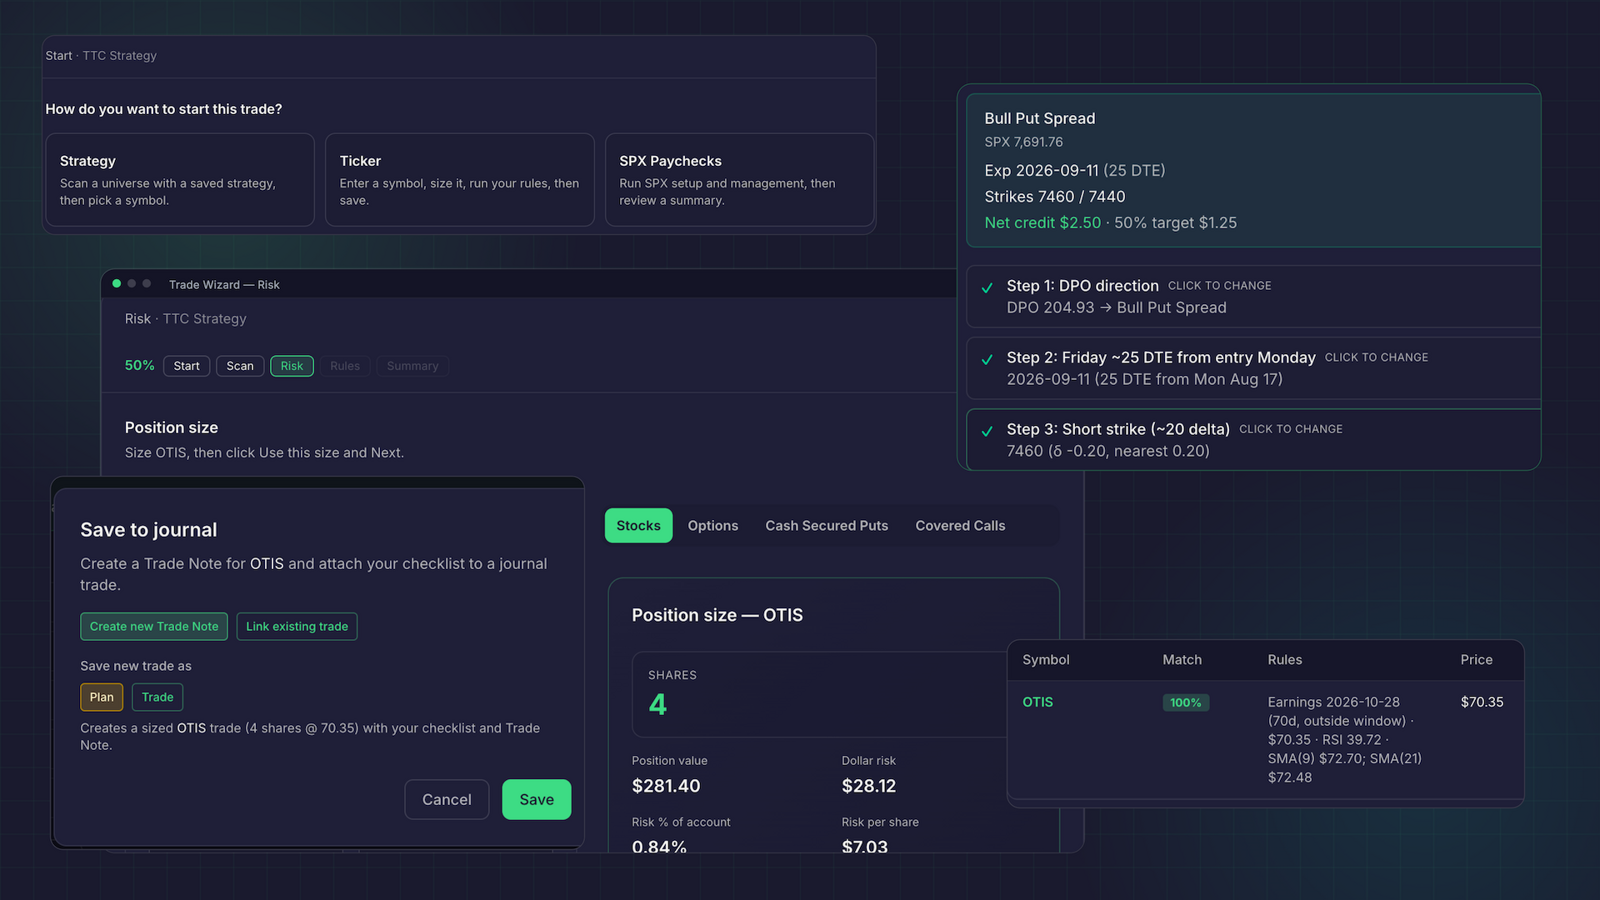
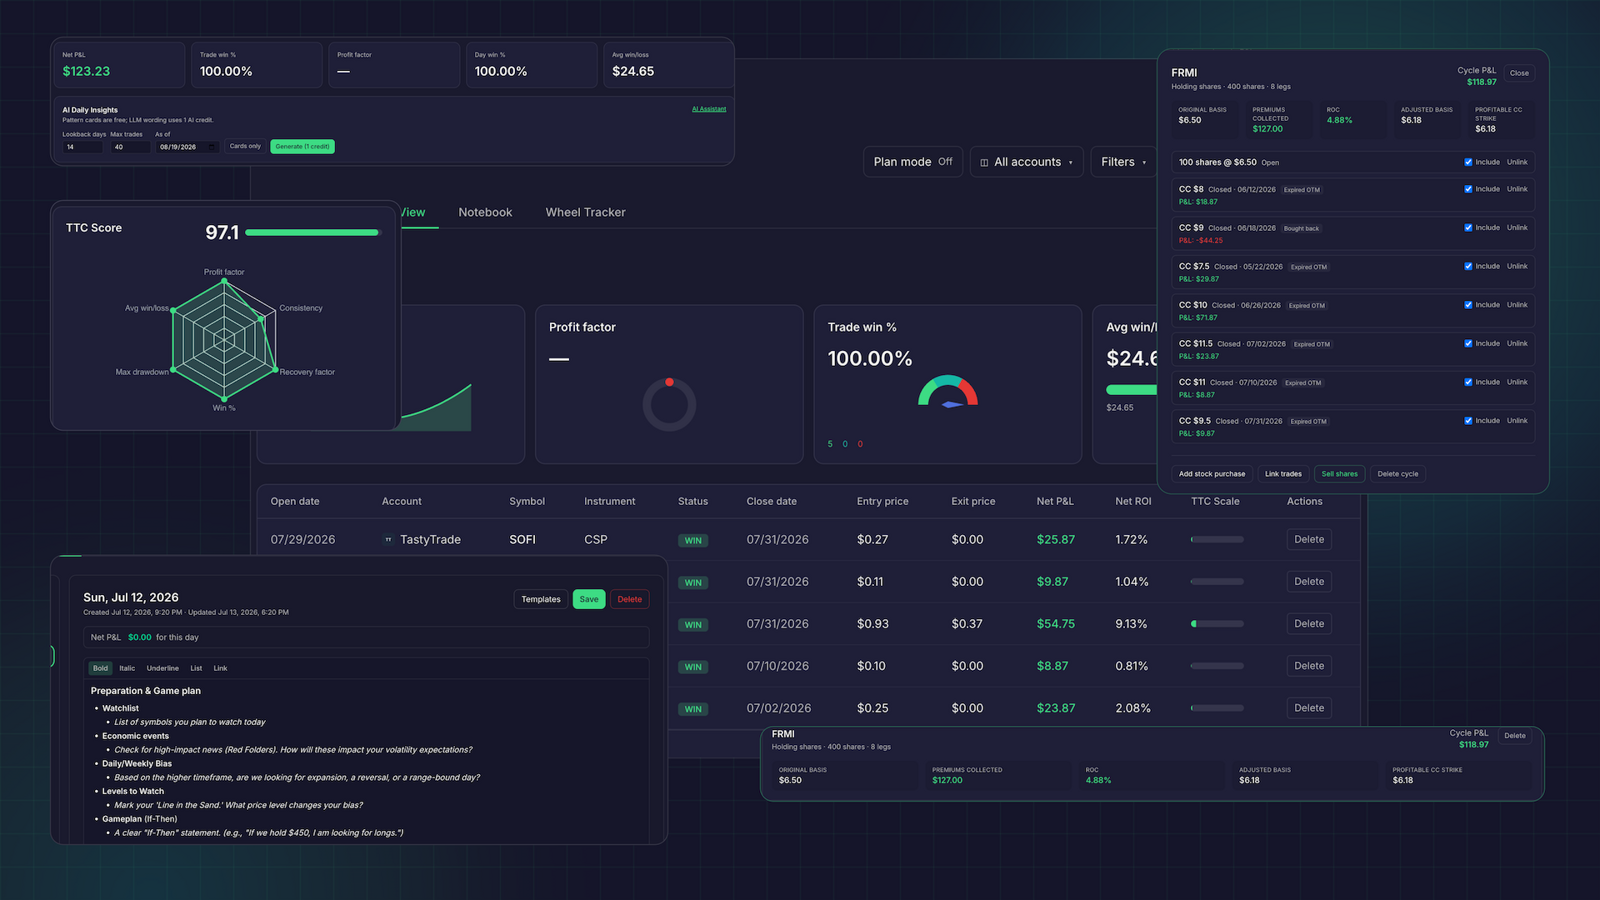
The Traders Tool Chest Strategy builder lets you save entry criteria, context filters, risk parameters, and exit conditions. Backtesting can test saved rules against historical data, including win rate, expectancy, drawdown, and equity curves. The Scanner can find matching setups; full US-market scans across 10,000+ tickers are a $30/month Pro add-on or included with Premium. Risk Management calculates share or contract counts, while Trade Wizard helps you build a sized plan and send it to your journal. Journal tools, including Trade Replay and AI Insights, support post-trade review.
Pro costs $60/month; Premium costs $120/month and includes the add-ons. Market data is roughly 15 minutes delayed, so the platform is not built for scalpers or sub-minute execution. You place orders with your broker.
Next step: turn the idea into written rules
A technique becomes a strategy when you define the conditions around it and decide how you’ll manage the trade from entry through review. Start by writing down what your signal tells you, and what it doesn’t.
Then follow our step-by-step guide to building a trading strategy to define your setup, filters, risk, sizing, exits, and review process.
Frequently asked questions
Is a trading indicator a strategy?
Not by itself. An indicator such as MACD can provide a signal or filter, but you still need rules for context, entry, risk, position size, and exit.
Do I need a complex strategy?
No. A simple strategy can be easier to explain, follow, and test. The important part is making the rules specific enough that you can apply and review them consistently.
Can I backtest a strategy before trading it?
Yes, if you can express its rules clearly and have suitable historical data. Backtesting can help you examine past performance, but it cannot guarantee future results or account for every real-world factor.
Does Traders Tool Chest place trades for me?
No. Traders Tool Chest supports planning and review; you place orders with your broker. Market data is roughly 15 minutes delayed, so the platform is not designed for scalping or sub-minute execution.
Disclaimer
No trading strategy guarantees profit. This article is for educational purposes only and is not financial or investment advice. You are responsible for your own research, decisions, and trades.